When we launched LiveSwitch Cloud in 2019, we emphasized the importance of making real-time WebRTC telemetry accessible. In the Communication Platforms-as-a-Service (CPaaS) industry where every second counts, our LiveSwitch platform makes real-time, data-driven decisions easier than ever before. The platform simplifies the day-to-day telemetry monitoring and reporting workflows - so DevOps and Support Teams can focus on what they do best. Keep reading to find out exactly how to leverage the power of real-time WebRTC statistics to deliver better streaming experiences.
Streaming Statistics in LiveSwitch Cloud
In your personalized LiveSwitch Cloud dashboard, the Sessions page displays a list of data from all the sessions hosted on your platform. This page, in addition to the analytics available from the dashboard, provides a complete overview of the number of users, devices, clients, and connections connected during a live broadcast. This information is segmented by each admin-configured channel ID. There are two session views: the live view and the last 24 hours view.
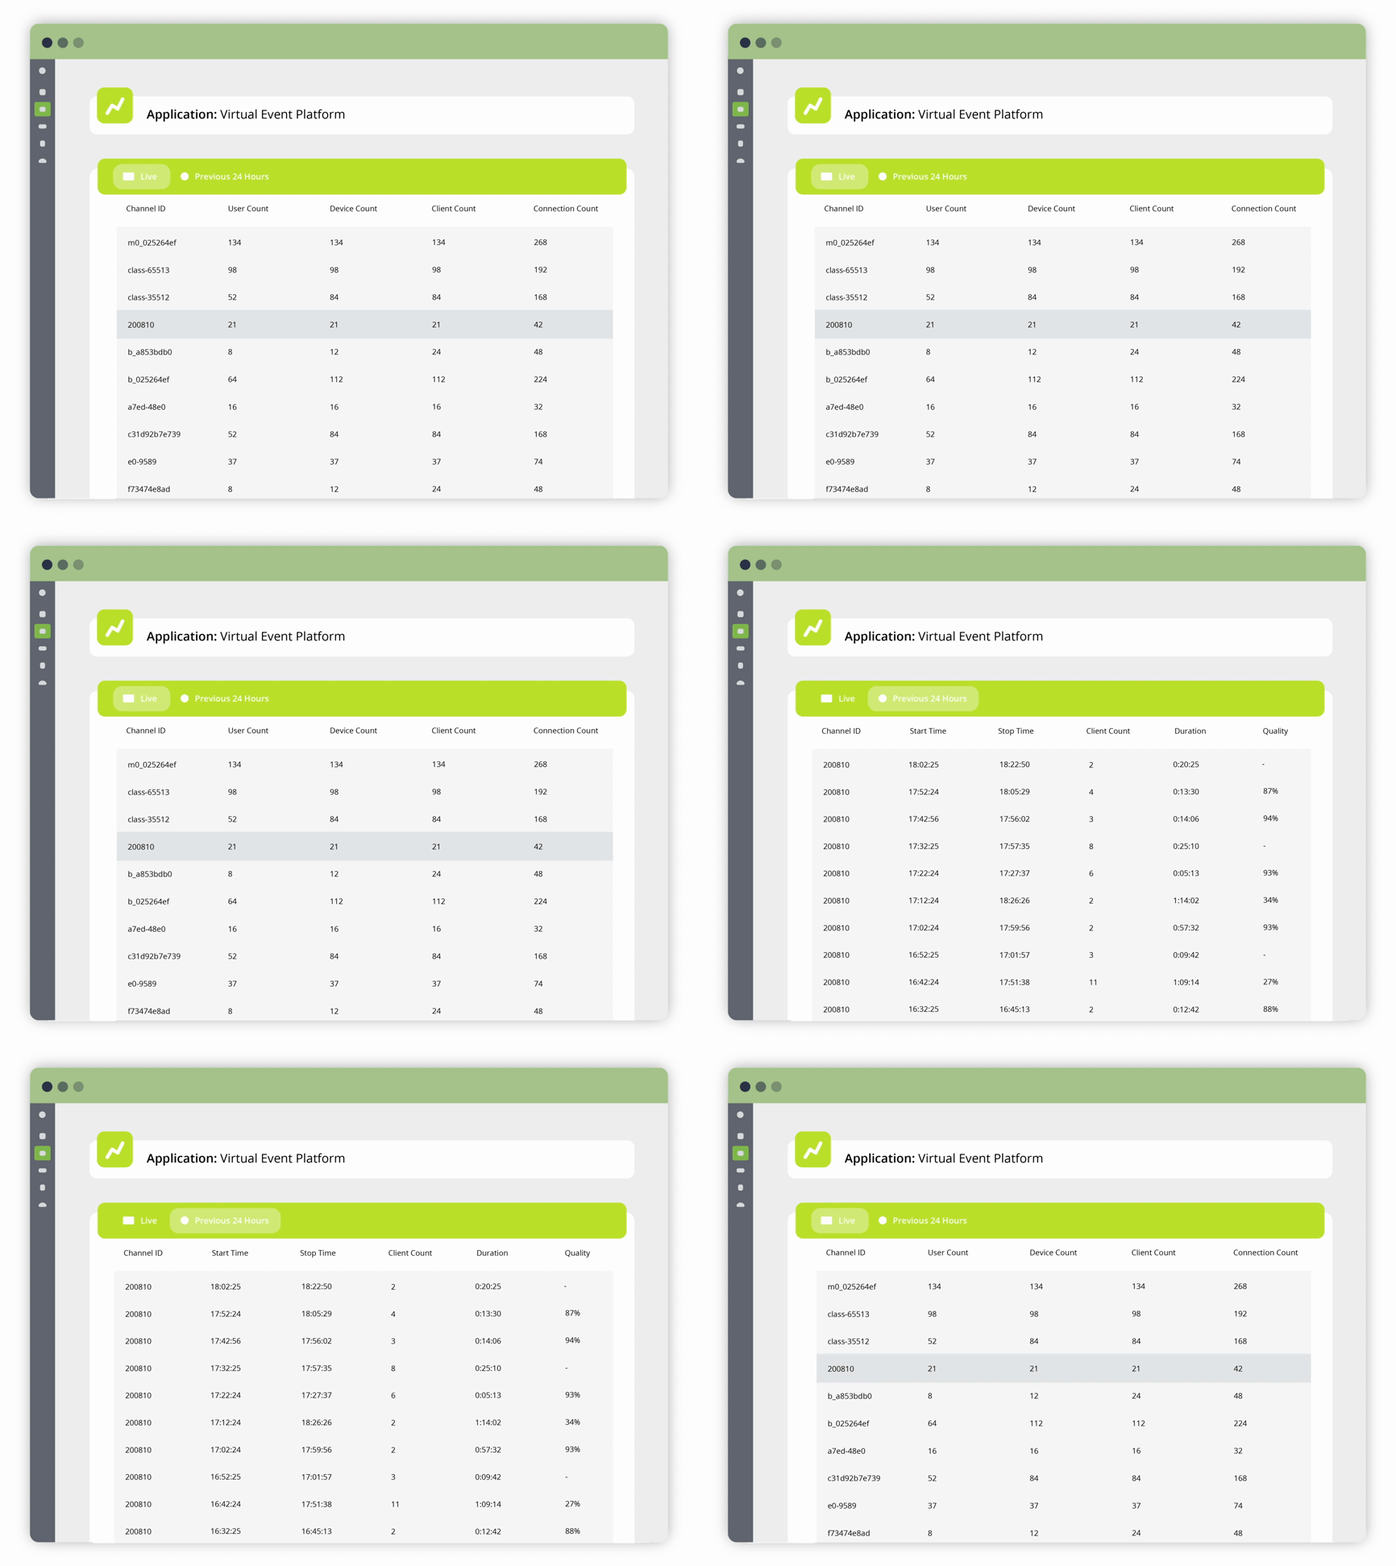
The Live View: As the name suggests, the live view displays session data that is updated in real-time. While the dashboard page shows the same counts for all sessions, the Session page sorts these counts by Channel ID.
The Last 24 Hours View: Streams that have finished can be found under the "Previous 24 Hours" view. For the next 24 hours, DevOps and Support Teams can review session data and gain a holistic overview of the performance of their individual channels.
Quality Scoring with LiveSwitch Cloud
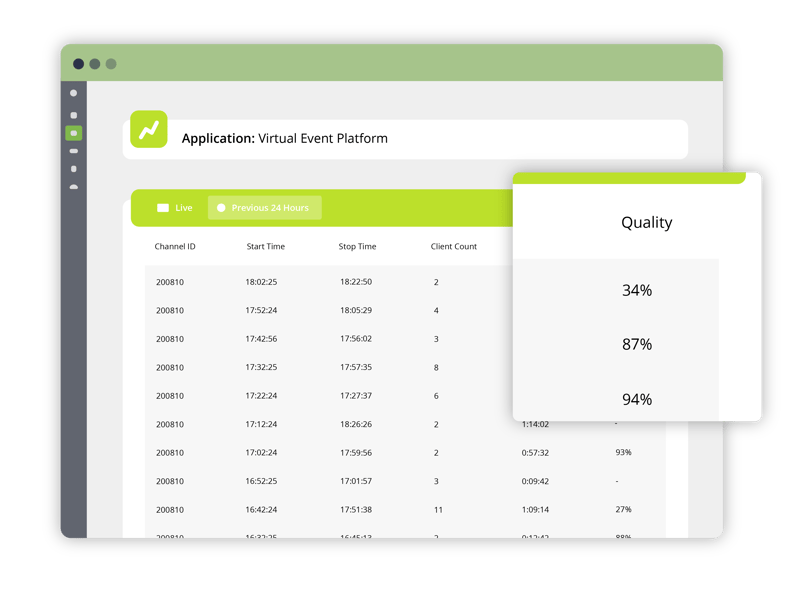
Under the "Previous 24 Hours" tab, each channel ID entry can contain a metric called “Quality”. This metric is produced for each channel opened in a session based on a predetermined set of criteria. This quality tool considers typical WebRTC statistics. LiveSwitch runs it automatically for some sessions. The final percentage can be evaluated against its neighboring values for the peace of mind that end users are receiving the exact video/audio quality.
With it, any outliers - in this case, channels suffering from poorly optimized or underperforming connections - can be immediately identified. For example, in the illustration above, a DevOps engineer can quickly scan the list of channels opened in the last 24 hours and find out how often streaming quality has dropped below their ideal benchmark - and under what conditions.
Note: LiveSwitch Cloud preserves telemetry data from sessions in the last 24 hours. Platform providers can easily upgrade to an enterprise plan to store longer telemetry data and track the historical performance of their platform.
Advanced WebRTC Statistics
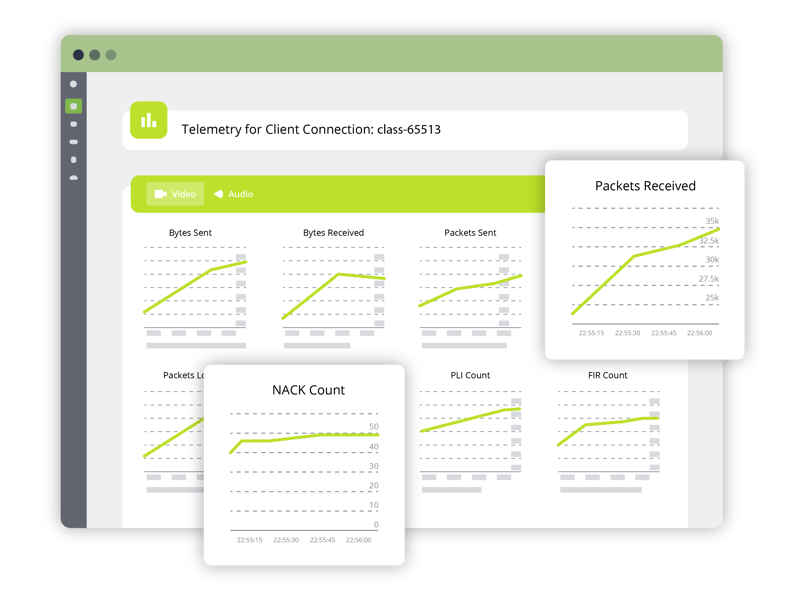
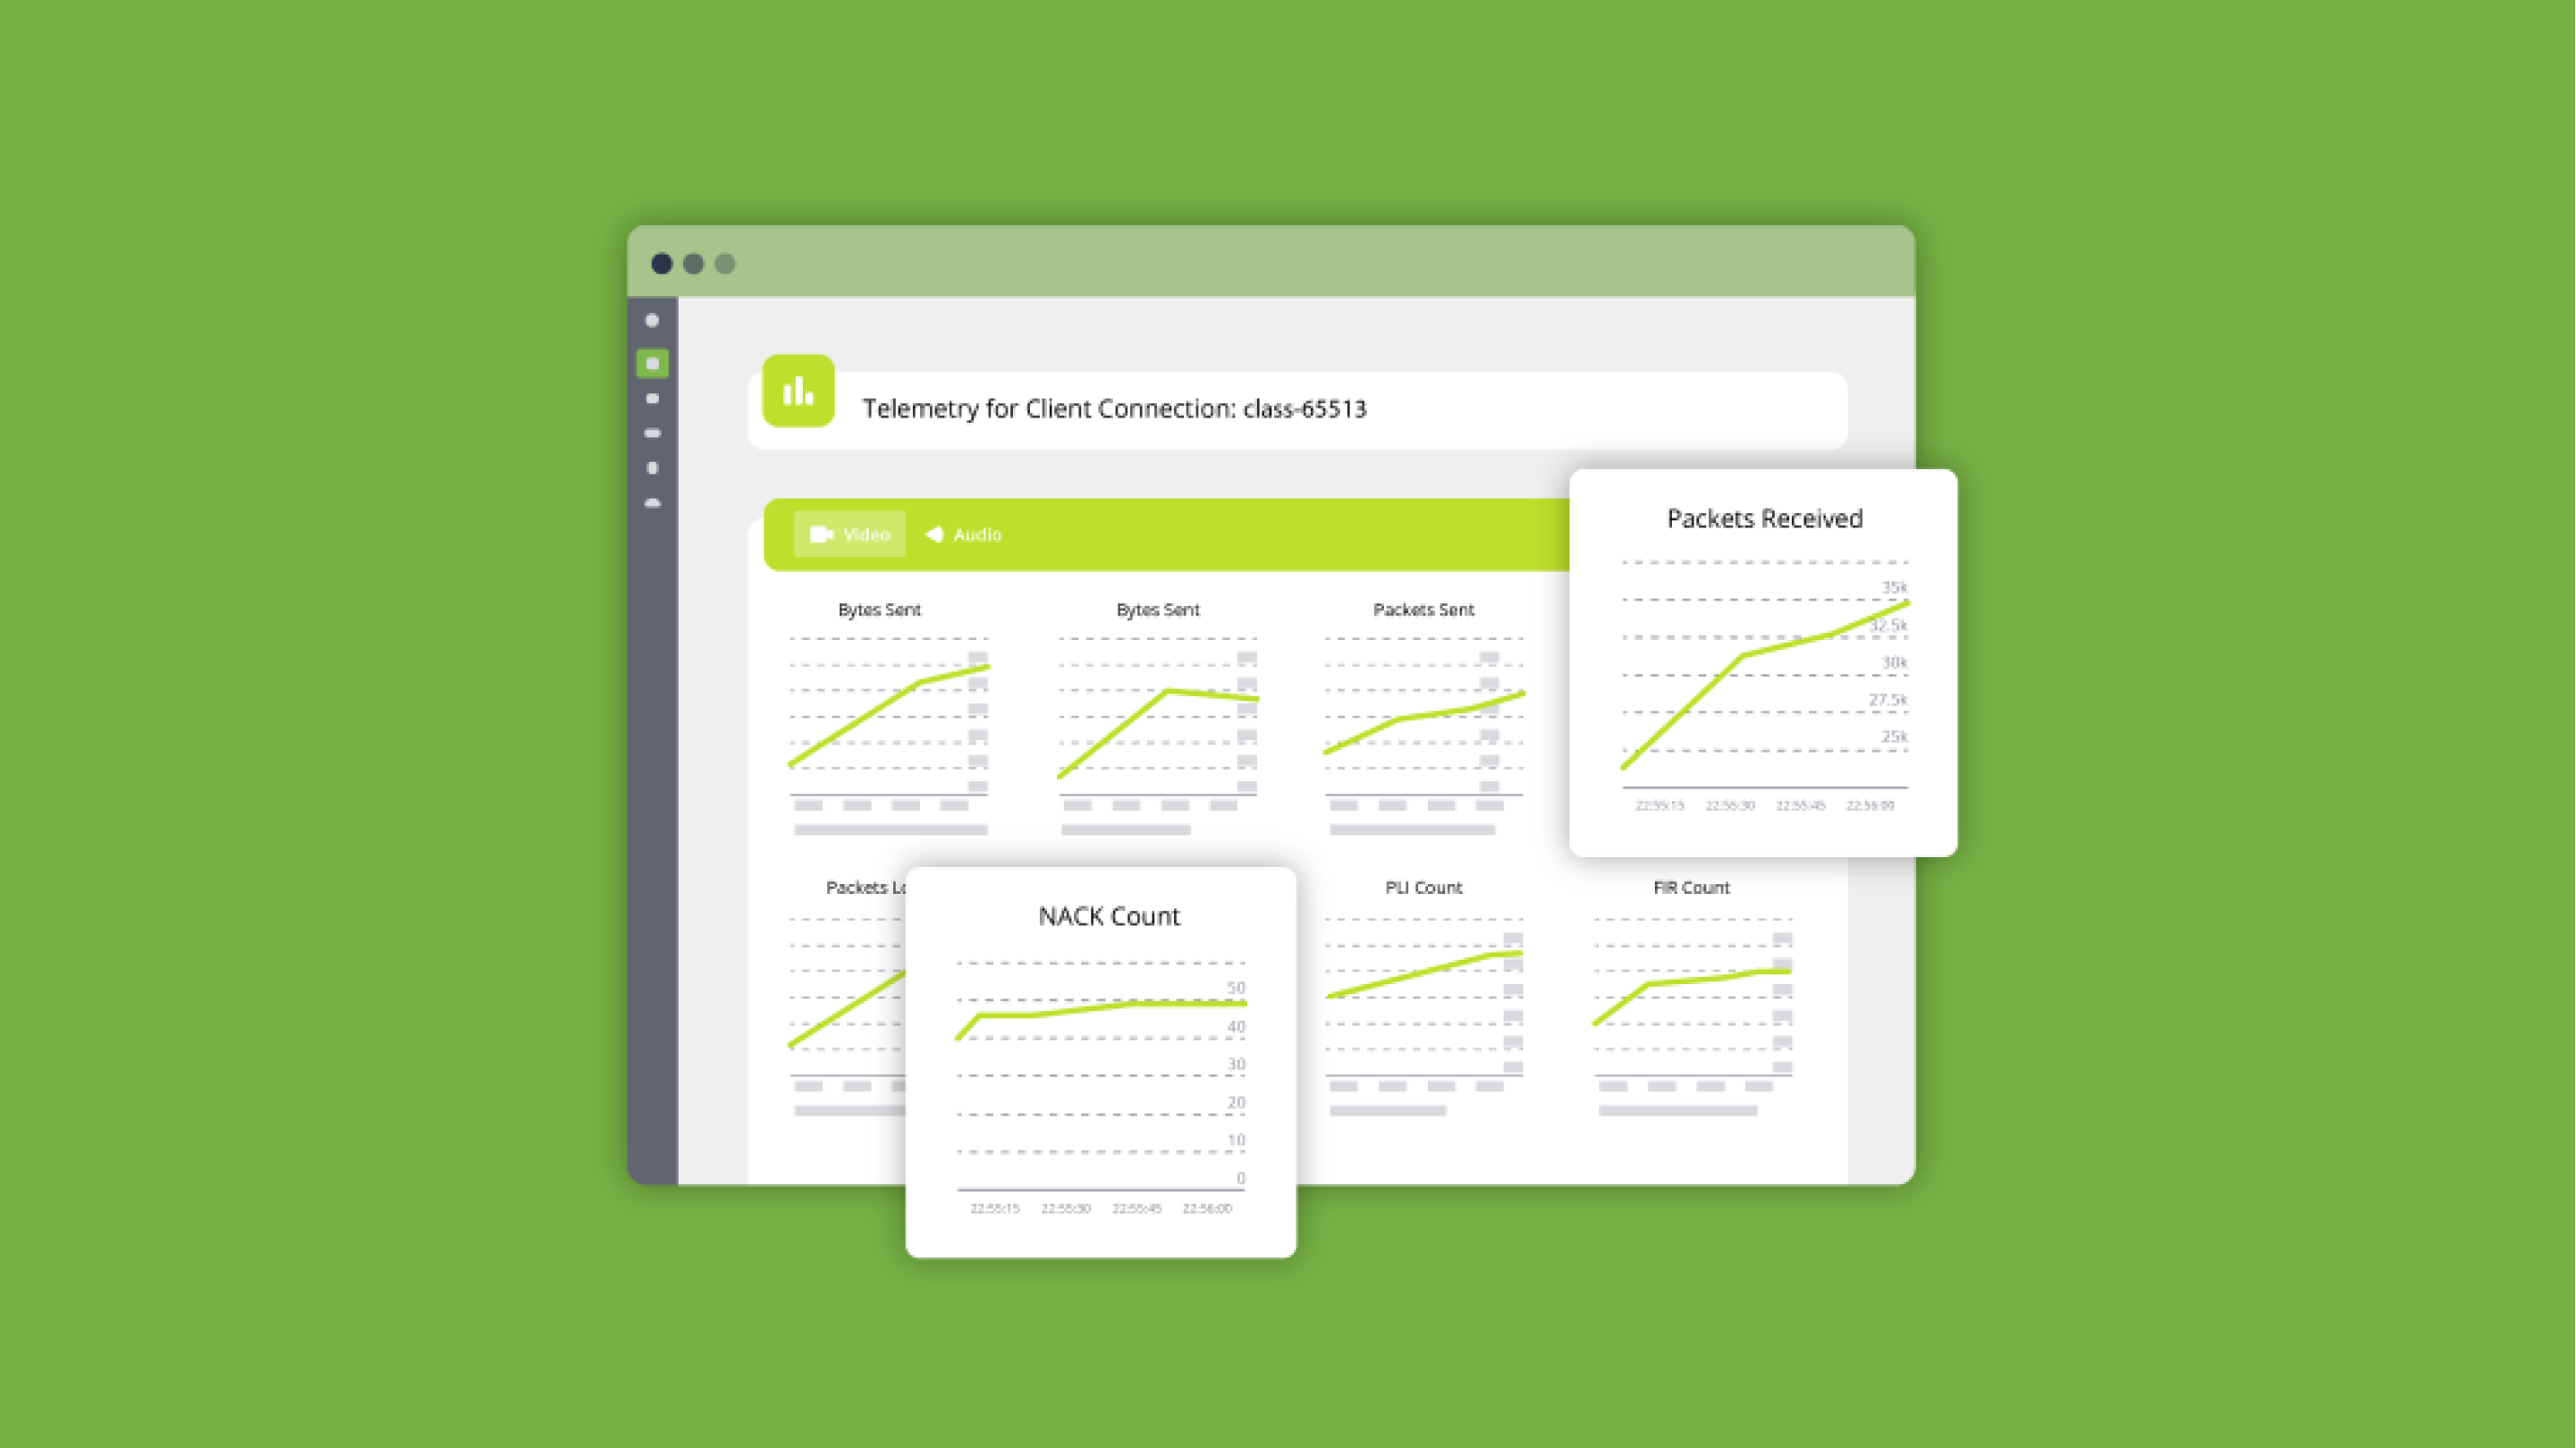
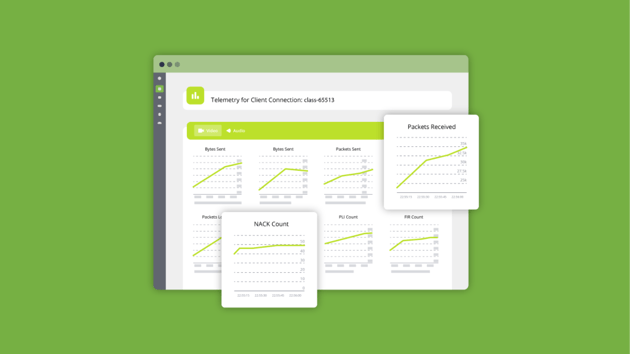
On the Sessions page, clicking on each Channel ID opens the Advanced Telemetry view. This page displays WebRTC statistics for individual video and audio connections for a particular Channel. On this page, the graphs are updated in real-time for easy monitoring and only require a connection from the Cloud console to your platform's application code layer to view. The getStats(). function gets this done.
connection.getStats().then(function(stats) {
    var transport = stats.getStreams()[0].getTransport();
    if (transport) {
        var localCandidates = transport.getLocalCandidates();
        var remoteCandidates = transport.getRemoteCandidates();
        var activeCandidatePair = transport.getActiveCandidatePair();
        var activeLocalCandidateId = activeCandidatePair.getLocalCandidateId();
        var activeRemoteCandidateId = activeCandidatePair.getRemoteCandidateId();
        for (var i = 0; i < localCandidates.length; i++) {
            var localCandidate = localCandidates[i];
            if (localCandidate.getId() == activeLocalCandidateId) {
                // this is the active local candidate

                // check the protocol - UDP or TCP
                var localCandidateProtocol = localCandidate.getProtocol();

                if (localCandidate.getIsRelayed()) {
                    // check the relay server IP
                    var relayServerIPAddress = localCandidate.getIPAddress();
                }
            }
        }
        for (var i = 0; i < remoteCandidates.length; i++) {
            var remoteCandidate = remoteCandidates[i];
            if (remoteCandidate.getId() == activeRemoteCandidateId) {
                // this is the active remote candidate
                if (remoteCandidate.getIsRelayed()) {
                    // check the relay server IP
                    var relayServerIPAddress = remoteCandidate.getIPAddress();
                }
            }
        }
    }
});
With our Connection Statistics API that closely follows the WebRTC Statistics API RFC, teams can establish connections in their Cloud dashboard and monitor the following WebRTC statistics:
- Bytes Sent & Received - shows bytes sent and received over a network.
- Packets Sent & Received - shows the data sent over a network.
- Packets Lost - identifies the packets lost during transit over a network (latency).
- NACK (Negative Acknowledgement) Count - identifies the number of times that the receiving party has failed to receive a specific packet(s).
- PLI (Picture Loss Indication) Count - tracks how often the receiver loses a full frame (or more) of a particular media.
- FIR (Full Intra Request) Count - indicates how many times the receiver of the media has indicated a refresh is needed.
LiveSwitch Cloud's advanced telemetry drills into these key statistics for both video and audio connections. It provides teams with the ability to diagnose drops in video/audio quality, decode the performance of each individual stream, and quickly fix problems as they arise. With this suite of internal built-in tools and capabilities, teams can provide continuous, quality experiences to end-users - and confidently handle anything that comes their way.
Focus On What You Do Best
Make fast, informed decisions with LiveSwitch Cloud's suite of built-in real-time telemetry statistics. Easily diagnose video and audio latency issues in real-time. Take the guesswork out of managing streaming sessions with real-time WebRTC stats displayed all in one place. Focus on what you do best and leave the heavy lifting to LiveSwitch's powerful API and platform.
